Coordinate Graph
The example below is Problem 1 in “Number Lines and Coordinate Graphs”.
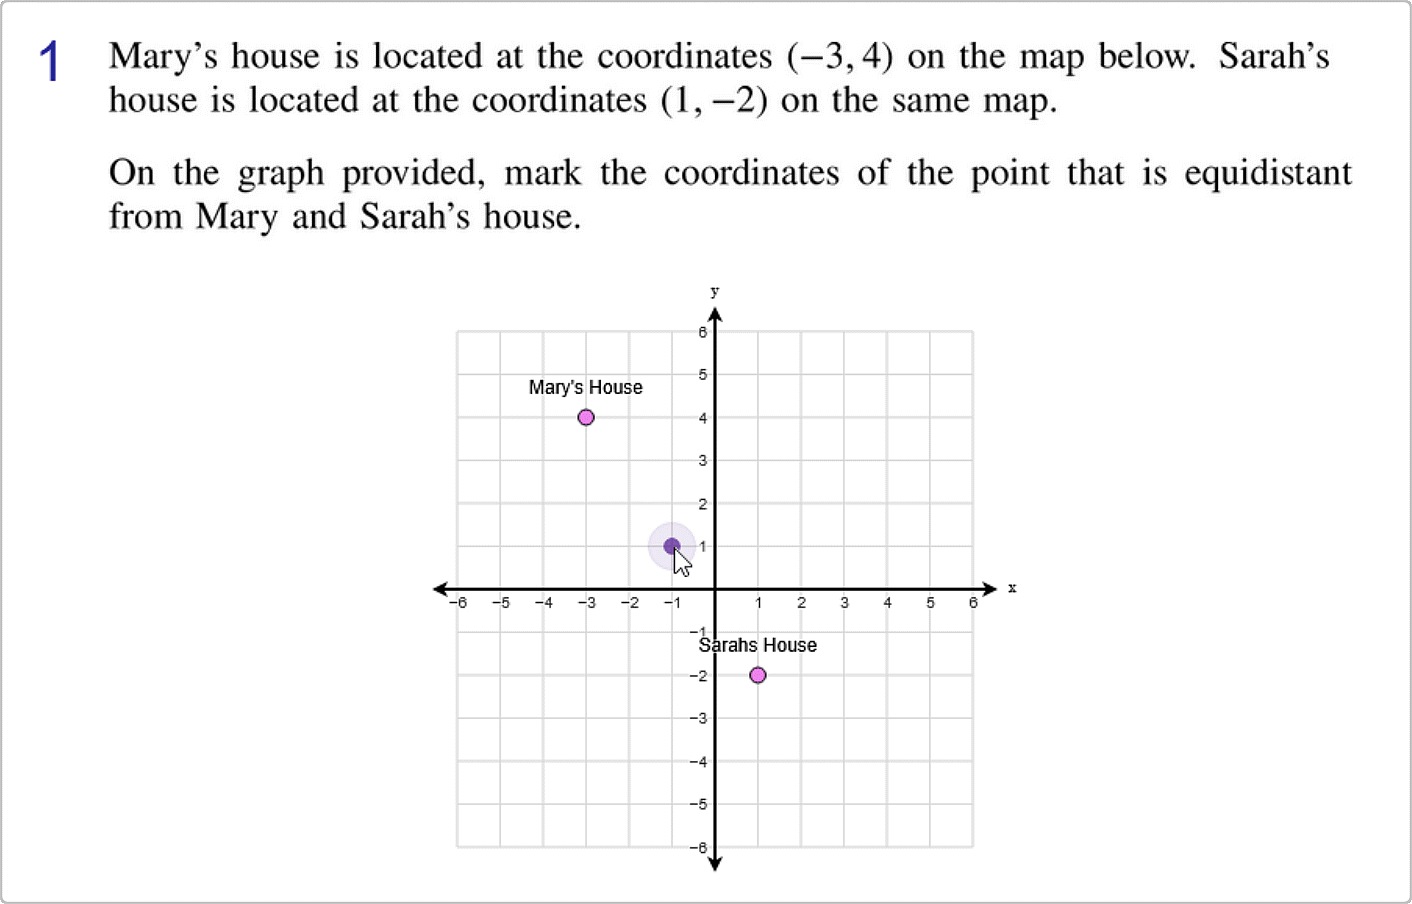
Thumbnail Preview

Example Video
Step-by-step instructions
Follow the below steps to create the above question in Problem-Attic.
-
Go to the Arrange tab and click Write New Problem.
-
In the editor, write the question and press Enter.
-
Click the Answer types menu and select Coordinate Graph.

-
In the Layout tab of the Coordinate Graph Properties dialog box, you can set the parameters that control the styling of the coordinate graph. Choose a style, and set the maximum, step, and subdivision for both the X and Y axes. Then, choose the number of quadrants. Type a title for the graph, as well as captions and labels for the X and Y axes. Lastly, choose a print size.

-
To set the answer, first click on the Answer tab. Select line from the Mode. Then either enter the equation of the answer line in the box, or click two points on the grid to manually graph the answer.

-
Click OK in the dialog box.
-
In the editor, click Online Test Preview to see how the coordinate graph question will look and behave in an online test. When you are done, close the Preview, then then click Save.
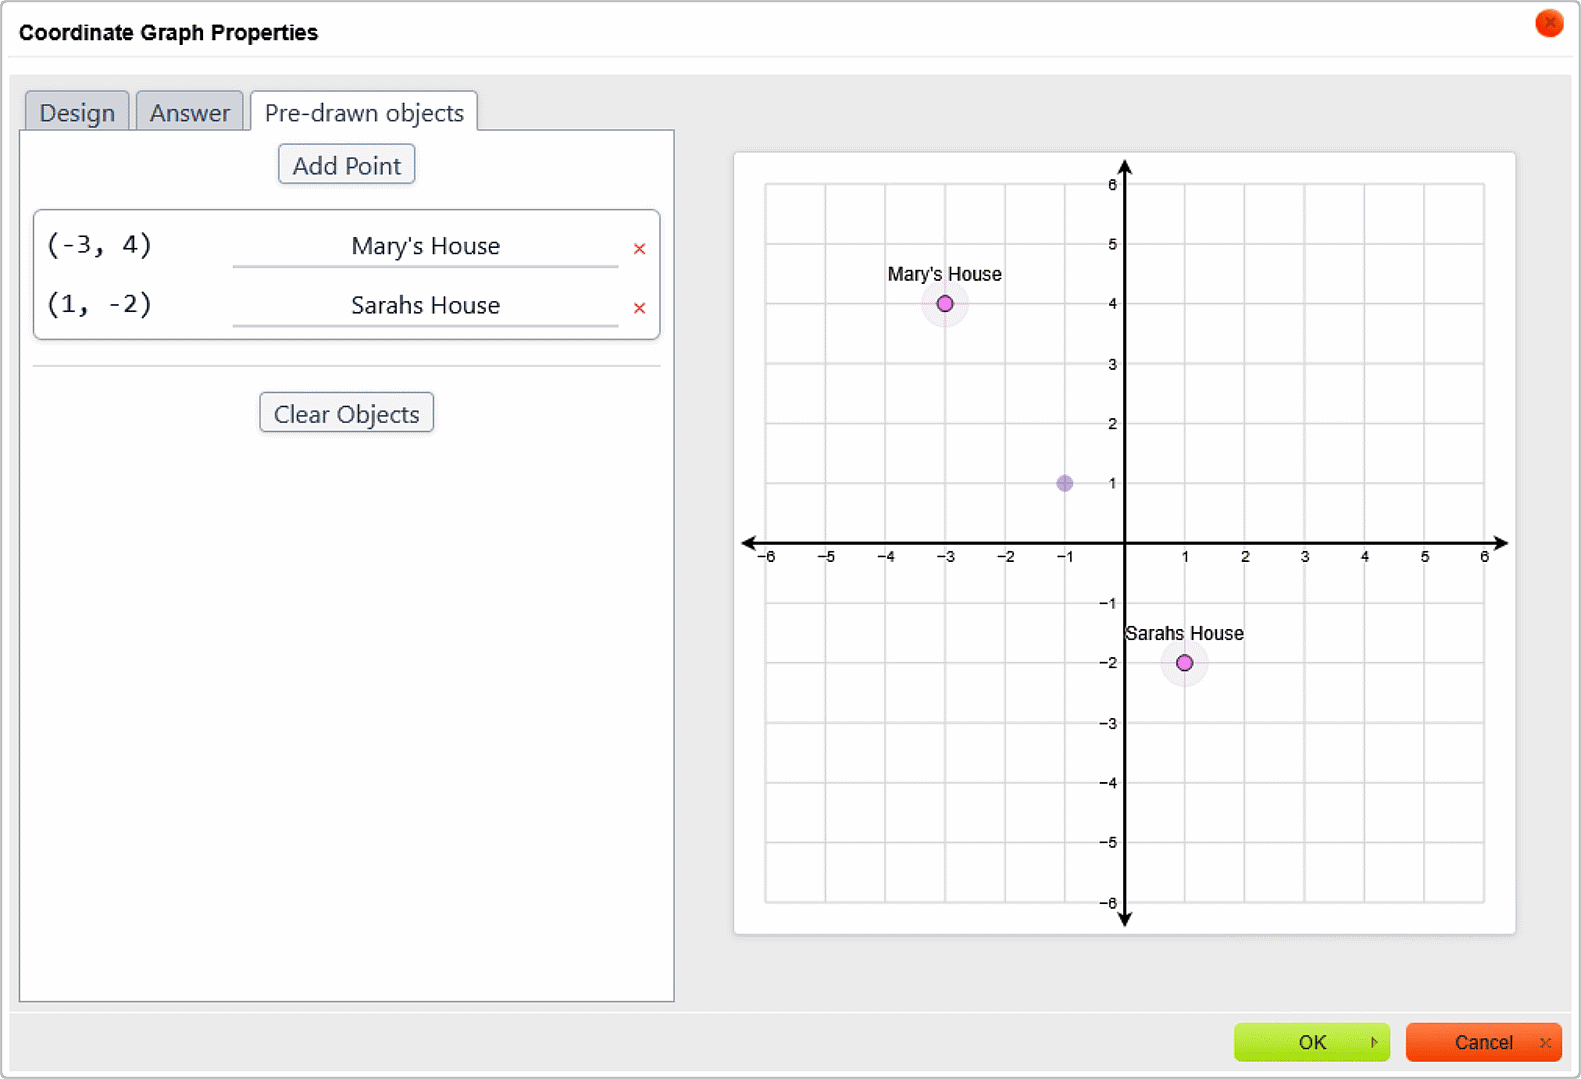
Pre-drawn objects
The coordinate graph question type also supports pre-drawn objects. In the In the Pre-drawn objects tab of the Coordinate Graph Properties dialog box, you can add labeled points will appear as part of the coordinate graph for the question.
Below is an example of creating pre-drawn points for a question that asks for the midpoint between two student's houses.
Below is the online test preview for the same question.